Spotlight
2019
Redefining the wayfinding experience for job seekers
Company
Randstad RiseSmart
Product
Spotlight (B2B2C)
Duration
3 Weeks
Team
3 Designers
My Role
Project Lead
Design
Research
Deliverables
Information Architecture
Wireframes
Research
Card Sorting
Tree Testing
Usability Testing
Overview
The Company
Randstad RiseSmart is an HR company that specializes in outplacement services. It helps former employees impacted by layoffs find new jobs faster by providing career coaching, resume writing, and job search assistance.
The Product
Our flagship product, Spotlight, is the one-stop shop for job seekers to find everything they need to get back on their feet. Users can book an appointment with their career coach to work on job interview preparation, request a resume writing service, or get matched with jobs that best fit their skill sets. It is a web app with mobile apps available as support.
Our web app before the redesign:

Before the redesign
Problem
If users can’t find it, it doesn’t exist.
You may notice the outdated aesthetics, but there was a bigger problem: poor navigation.
Users were struggling to find resources on our platform. This was problematic because not only was it a poor user experience, but we might be losing potential revenue. Our revenue depended on the services requested by participants, many of which came directly from our platform; thus, any navigation difficulties would lead to a loss in business.
How did we get here?
Our platform was about ten years old. Over time, new features were added without modifications to the UI because of the same old story: we didn't have time! As a result, the menu grew longer and longer, and new content was “squeezed” into the page without rearranging the page structure, making it more difficult for users to find things. The UI structure became unsustainable as we continued to slap more stuff into the UI. We decided to tackle the problem with a systematic approach through a holistic redesign.
Design Brief
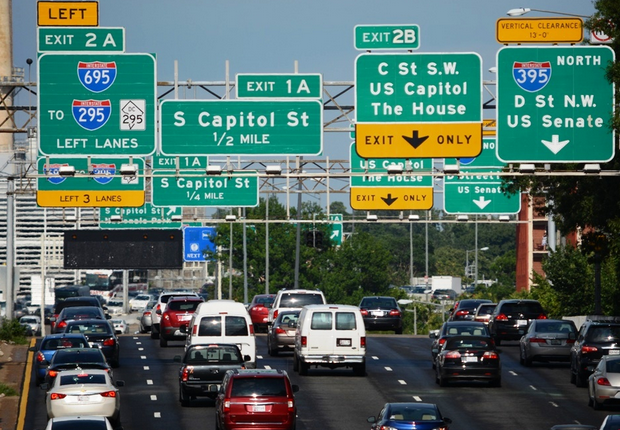
Redefine the wayfinding experience to help job seekers quickly understand what’s offered and where to find them.
My Role
There were two phases for this project:
I led the first phase of the project, delivering the information architecture and wireframes in collaboration with two other designers. I provided the strategy and conducted user research. Then, as a team, we collaborated on the design of the information architecture, wireframes, and UI redesign.
Pillars of Success
These three design elements are critical to crafting a successful wayfinding experience:
Strategy
The strategy for success is to involve users along the way. We stayed close to the users throughout the design process by conducting studies, including usability testing, card sorting, and tree testing, to validate assumptions and refine designs.
Process (Phase 1)
Measure Findability & Discoverability
Define Information Architecture
Create Wireframe
1. Measure Findability & Discoverability
I conducted usability testing with 5 users to help us validate the problem, get buy-ins, and set the benchmark. We uncovered the usability issues that prohibited users from accessing our key offerings, such as resume and coaching services.
2. Define Information Architecture
Instead of relying on design “experts” to define the site structure, I believed we’d have a better chance of arriving at a more intuitive structure if we let the people who’d be using the system “tell us how to design”. Therefore, we performed card sorting to uncover the user’s mental model around content sorting. We then transformed the insights into the site structure and iterated it through tree testing.
Card Sorting
Card sorting is a research method for understanding how users make sense of the information on your website. Users are asked to sort a deck of cards that represent the content on your website into categories as they see fit.
We performed a remote, unmoderated, open card sort where participants had to define the labels for the categories they created. From there, we gained inspiration on how to best organize our content from the user’s perspective.
For preparation, we conducted a few offline sessions with our PMs and designers to ensure quality and align on the purpose and process of this project.
We performed an unmoderated, remote, open card sort with 19 participants. We asked them to group 29 cards into categories as they saw fit and name the groups they created.
For analysis, we looked at the data by slicing and dicing them in different ways:
Participants: How did people sort information on an individual level? What was the logic behind the groupings?
Cards: What were the categories created for each card? Was there any consistent pattern?
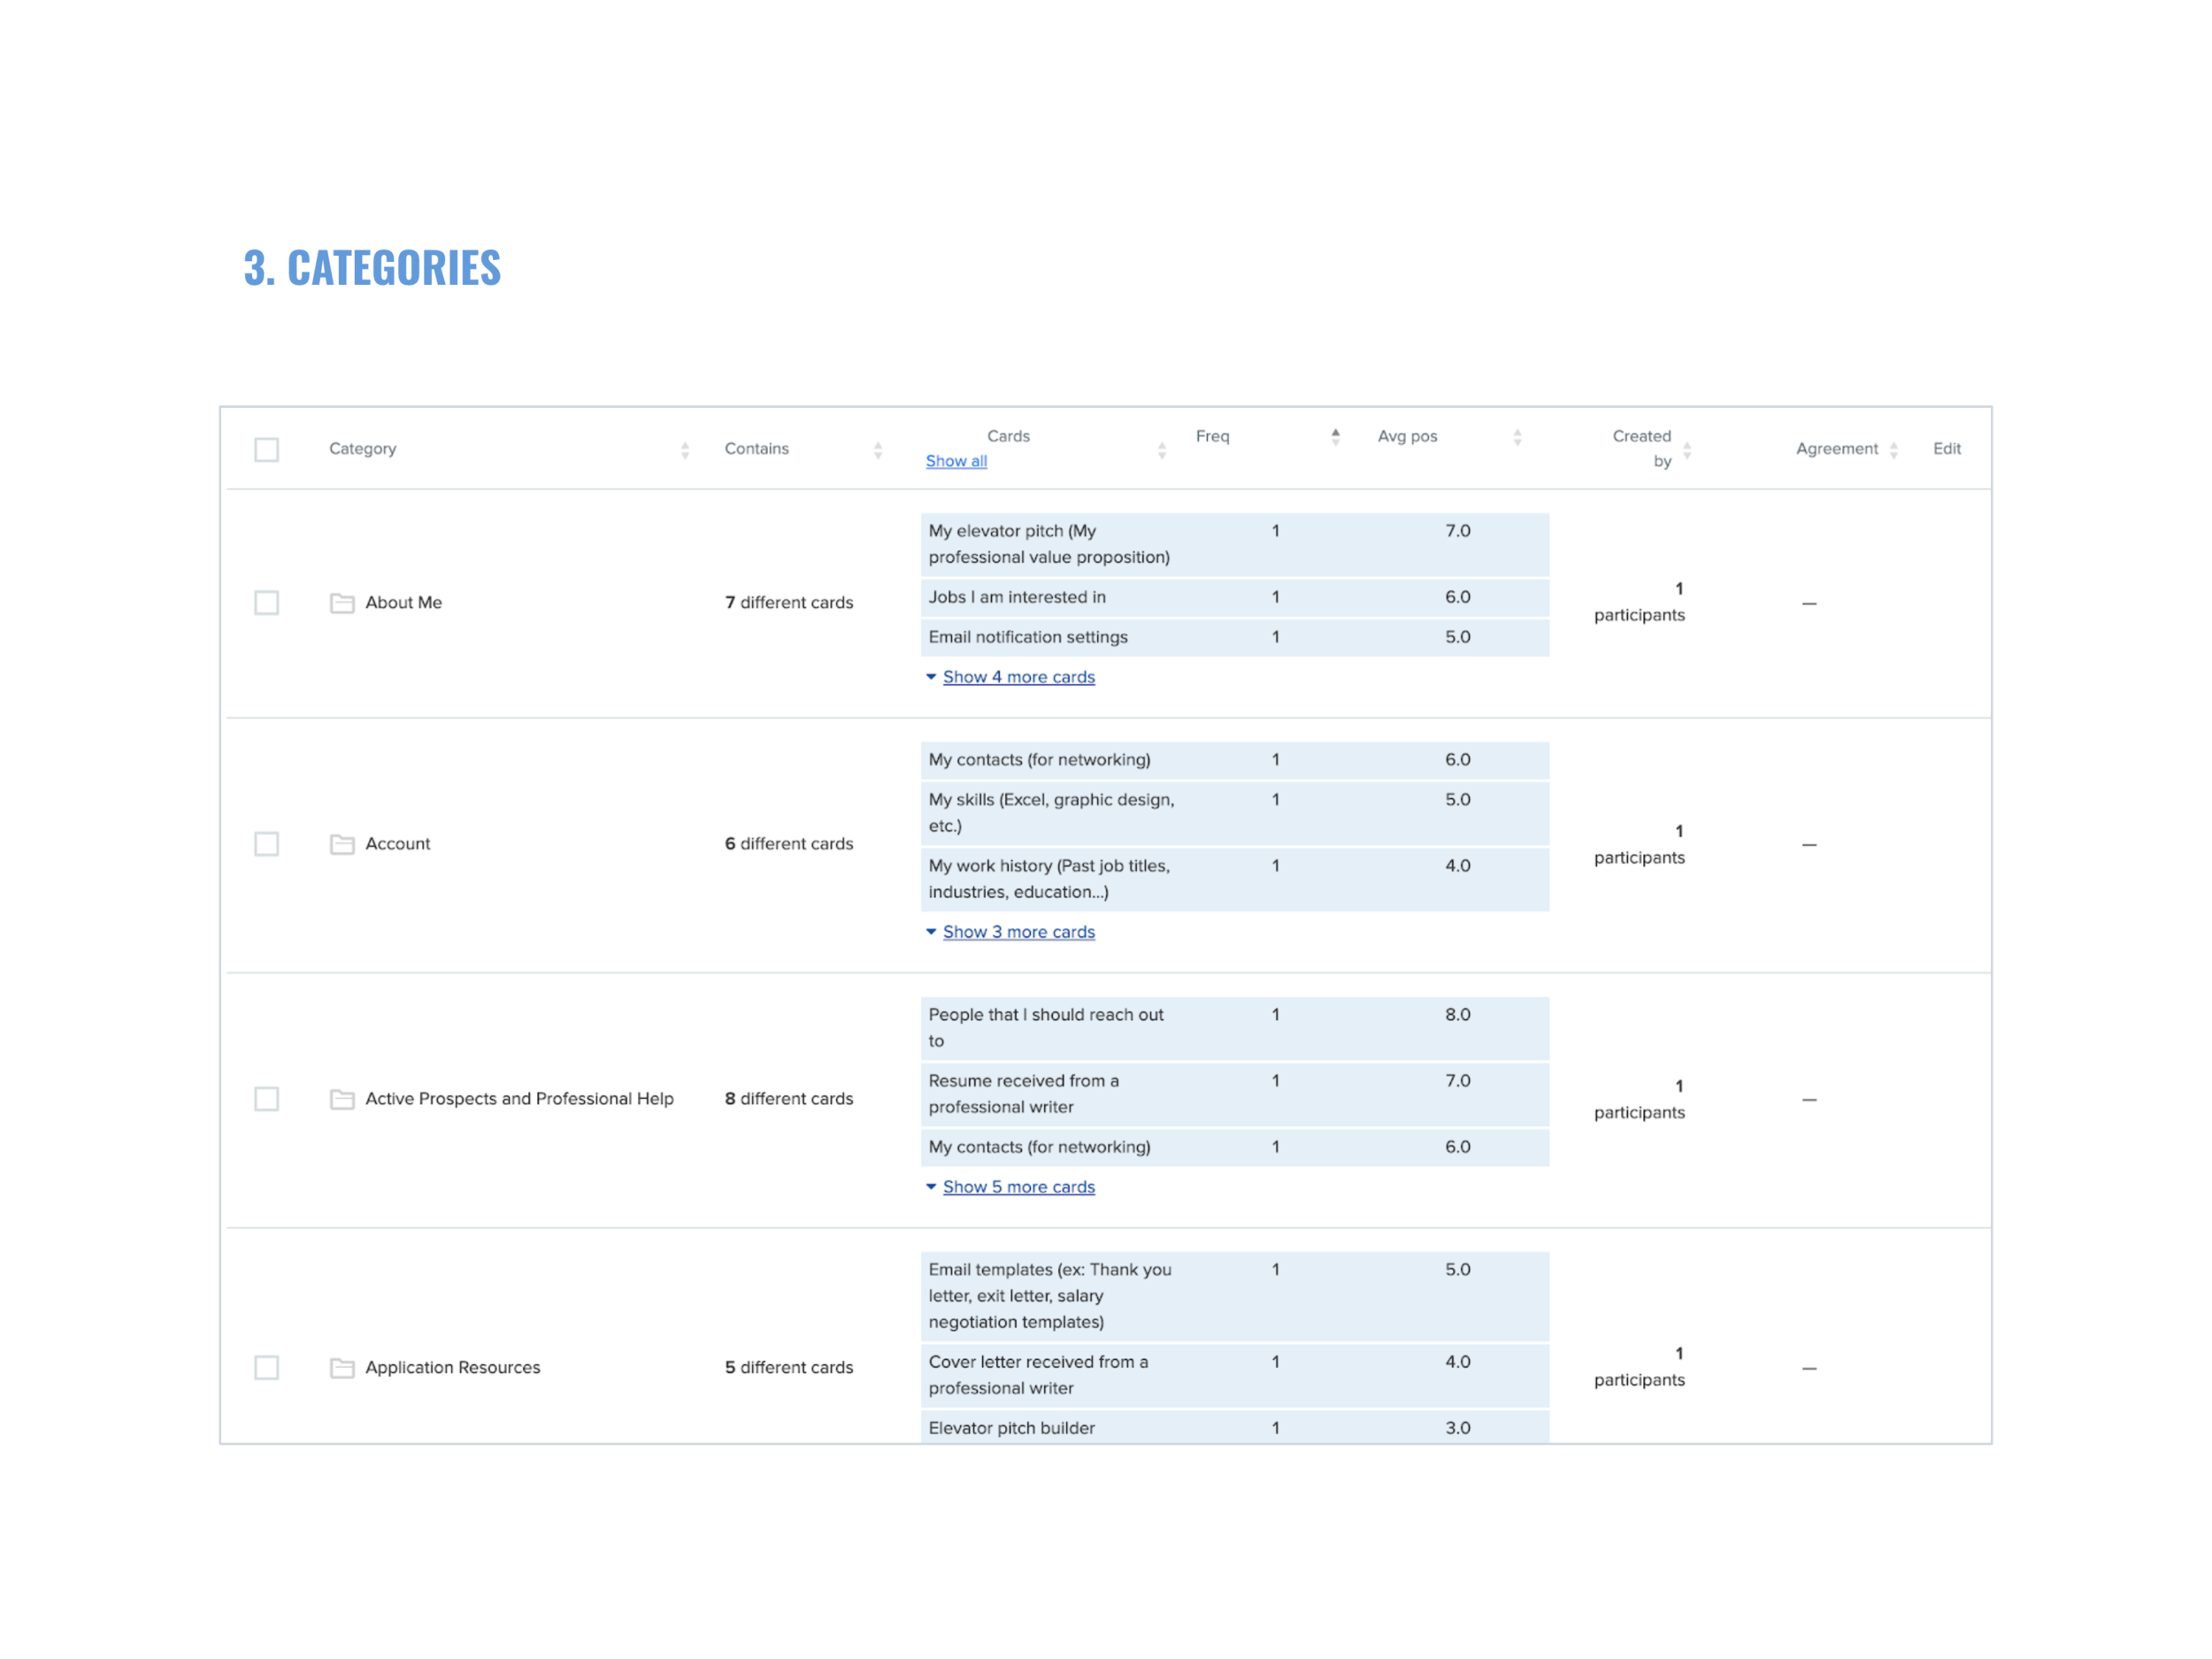
Categories: What categories did people create? What cards were sorted under these categories?
Similarity Matrix: How often were two cards paired together?


So, how do people sort the content? We’ve discovered some interesting findings such as the different ways people sort information:
By relevance: related to me vs. not me
By timeline: past, present, future
By urgency: to-dos vs. no action needed
By topics: interviews, job search, networking
By stages: job search, interviews, receiving job offers, salary negotiation
So, what’s the best way to sort the content?
I was struggling so hard to find the right way to sort information. Eventually, I realized there was no such thing as the perfect way of sorting because every individual was unique. We were different in many ways, from gender, age, occupation, and background, to personal goals. This led me to the conclusion that we should design for users of different mindsets. In other words, a good design should accommodate users with different mental models. This could be done by providing multiple pathways to the same destination.
Tree Testing
While card sorting is great for understanding how our users think, it doesn’t tell us whether our proposed site structure works. Tree testing tells us how easily people can find information on our site, and where they get lost. It is a fast and iterative way to evaluate whether our categories and labeling make sense to the users.
We started by mapping out the tree representing the current website and the new tree in a table view:
We quickly found ourselves in a difficult situation when each designer proposed a unique structure. How would we know which one was better? Would the better one solve the problem? Would it create new problems?

We decided to resolve this conflict in a civilized way - tree testing. We compared the performance of the trees proposed by each designer. Then, we selected the best one for further refinement and iteration.
For the test, we defined a list of tasks focusing on our most important offerings and potential problem areas:
We built the trees using Treejack, and asked participants to complete the list of tasks by navigating through the tree we set up. Below is a demo showing a participant clicking through the tree to find the target item:
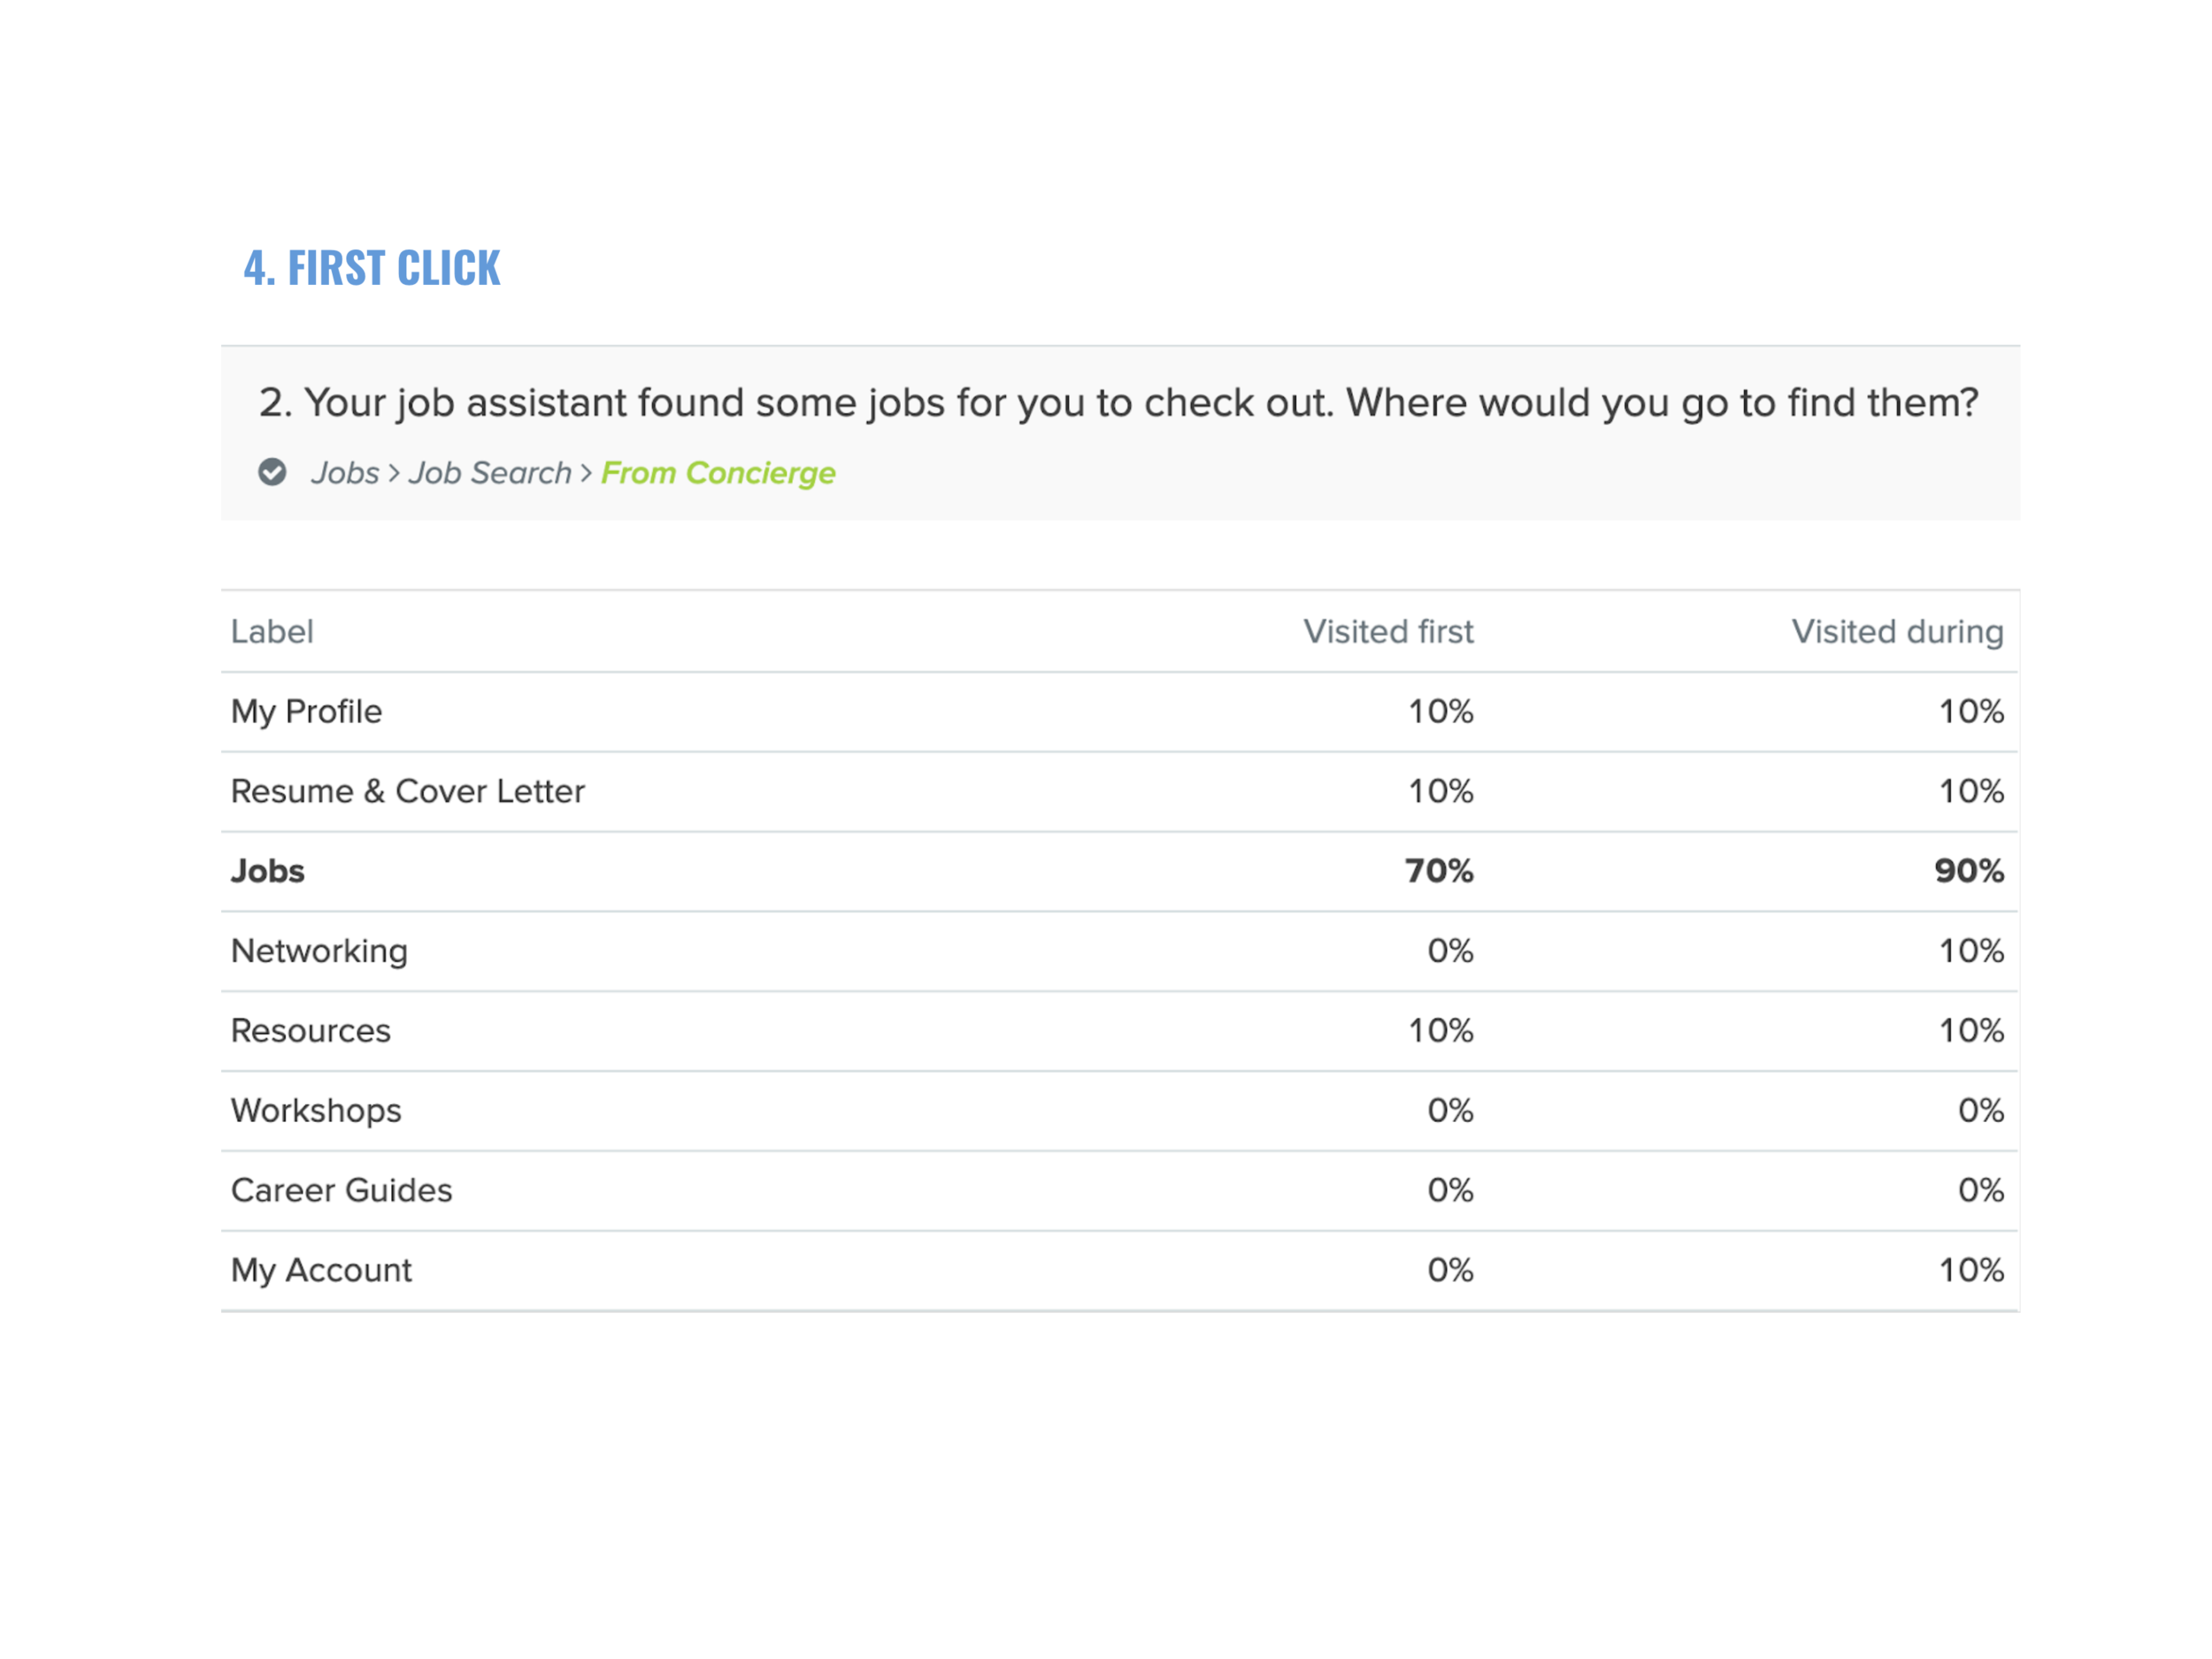
TASK: Your job assistant found some jobs for you. Where would you go to find them?
Logistics:
Remote, unmoderated testing
Tested 4 trees
10 Participants / Tree
6 Tasks / Tree
Average time to complete: 3 mins
For analysis, we looked at the results from a few different angles:
Success rate
Pietree
Destinations
First click
Paths


3. Create the Wireframe
Arriving at an intuitive site structure was only half of the battle. The next step was to transform that structure into an interactive experience for our users.

We created rapid iterations of low-fidelity clickable prototypes using UXPin. Having a tangible prototype allowed us to explore and evaluate the user flow, page layout, and navigation in an environment close to the real world. We didn’t have to (and shouldn’t) rely on our imaginations on what users would see or feel when clicking on a certain link in the UI.
Outcome
The redesign improved product discoverability and findability, making it easier for our users to navigate.
Here are the things we did to improve the way-finding experience:
Reduced cognitive load with a cleaner UI. We also reduced the number of CTA buttons on a page, making it easier for users to focus on the most critical tasks.
Adopted a more intuitive site structure with better labels. We moved away from marketing jargon to simple language that people use in their day-to-day, as we learned from card sorting. For example, we replaced “Your brand” with “My resume”.
Surfaced our key offerings that were previously buried a few levels down in the navigation. For example, we “elevated” our resume service from level two to level one of the navigation, making it easier to spot and access.
Introduced a more sustainable navigation UI. Instead of stacking new features onto a page every time, the new dropdown navigation structure offered a simple and scalable solution for new features or content (This also made the lives of designers and developers much easier).
Before
After
Measuring Success
How did we know if the redesign was successful?
As we completed the redesign, there was a shift in priorities, so we didn’t get the chance to measure the impact of the redesign. If given the opportunity, I would evaluate the following metrics:
Usability
Task completion rate
Time on task
Service Requested
Number of coaching sessions requested
Number of resume writing services requested
Cost Savings
Time reduced on tech support by coaches
User Satisfaction
System Usability Scale (for system)
User satisfaction (for service)